Your entire exam prep journey — visualized in real time.
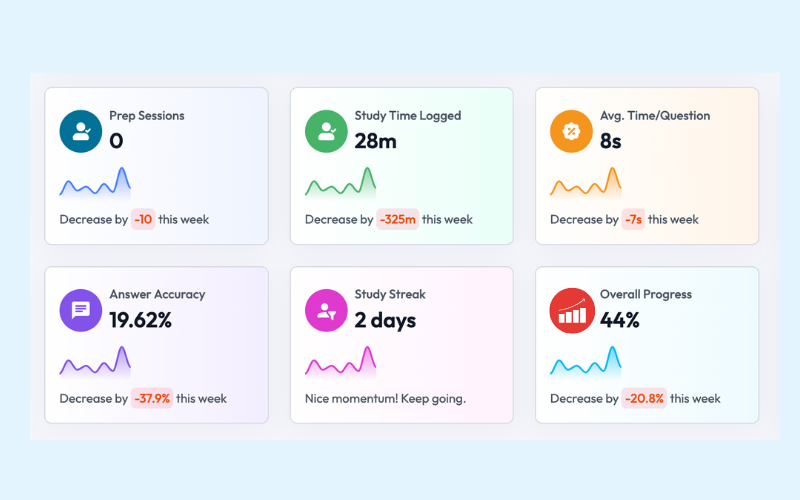
The moment you log in, your dashboard shows you exactly where you stand. Live stat cards display your overall accuracy (with partial credit for NGN questions), study time logged this week, overall progress across all subscribed tests, prep sessions completed, average time per question, and your current study streak.
Each stat includes week-over-week change indicators — green badges for improvement, red for areas needing attention — so you can see at a glance whether you're trending up or down.
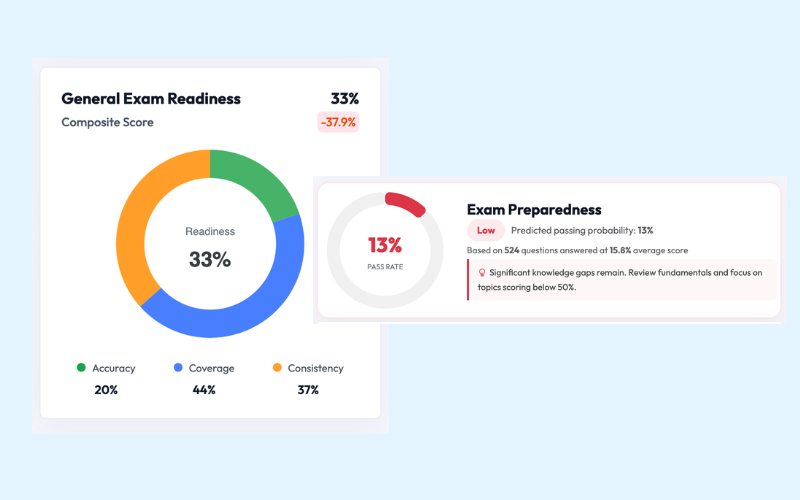
Our proprietary Exam Readiness Score combines three factors — Accuracy (40%), Coverage (35%), and Consistency (25%) — into a single composite number that tells you how prepared you are for test day. It updates after every practice session, giving you a clear target to aim for.
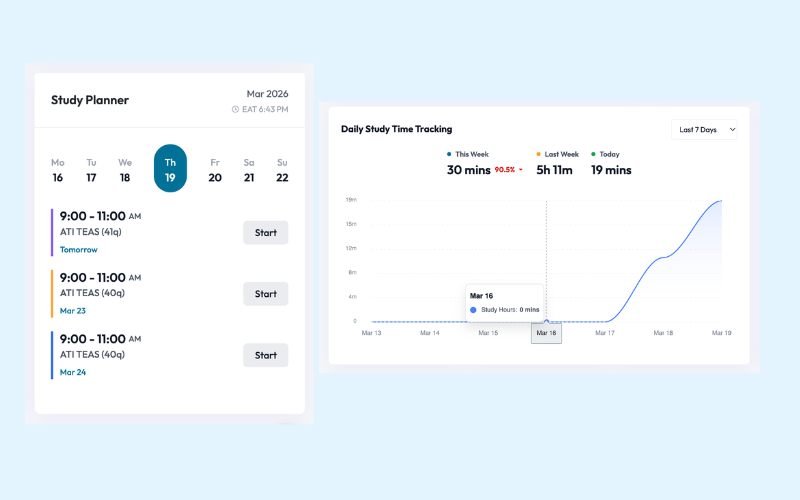
An interactive daily study time chart lets you select different date ranges (7, 14, or 30 days) and compare this week vs. last week. You can also see your recent exam sessions for quick access and a study planner preview showing upcoming study blocks right on the homepage.
Join thousands of nursing students who use Keslaly to study smarter and pass their exams.
Start Practicing Free