Know exactly where you stand — down to the individual topic.
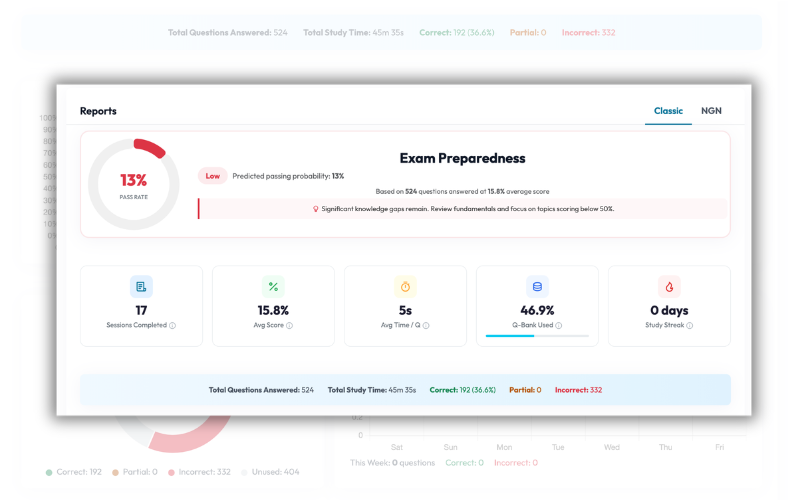
The Reports tab inside every test's Q-bank gives you a comprehensive overview split into Classic and NGN views. See your Q-bank coverage (total questions, attempted vs. unused, usage percentage), overall performance (correct, partially correct, and incorrect counts with average score), and your per-test study streak.
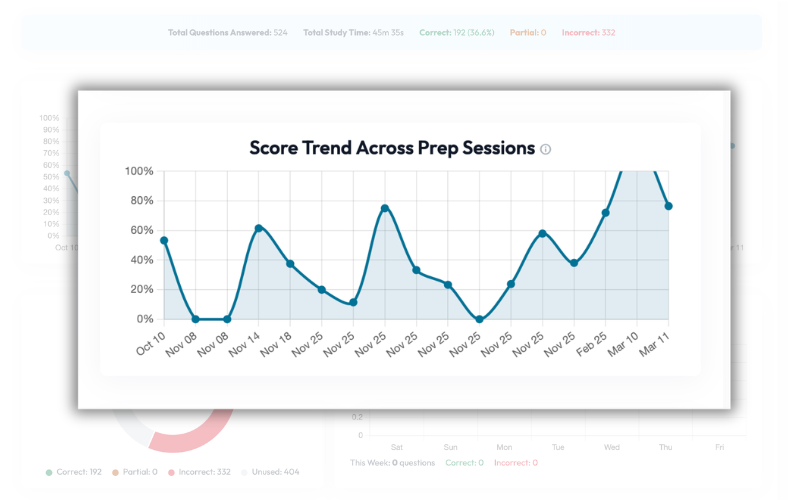
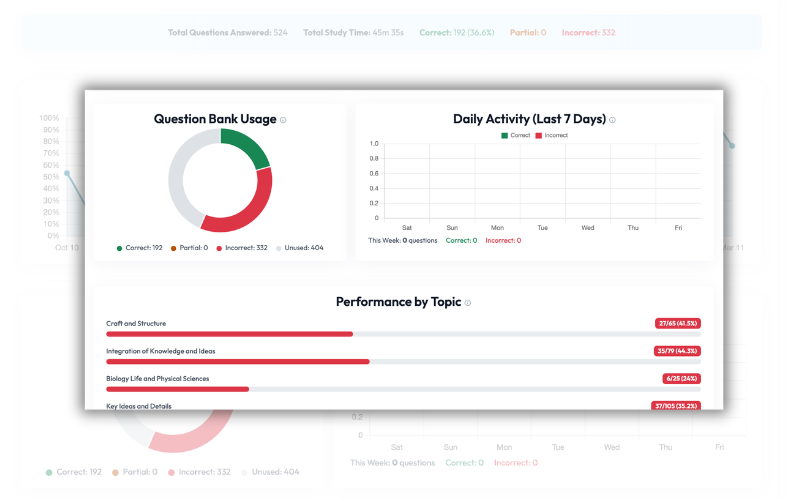
A line chart tracks your scores across up to 20 completed sessions, making it easy to spot improvement over time. Combined with a weekly performance bar chart (correct vs. incorrect per day over 7 days), you get both the long-term trend and the day-to-day picture.
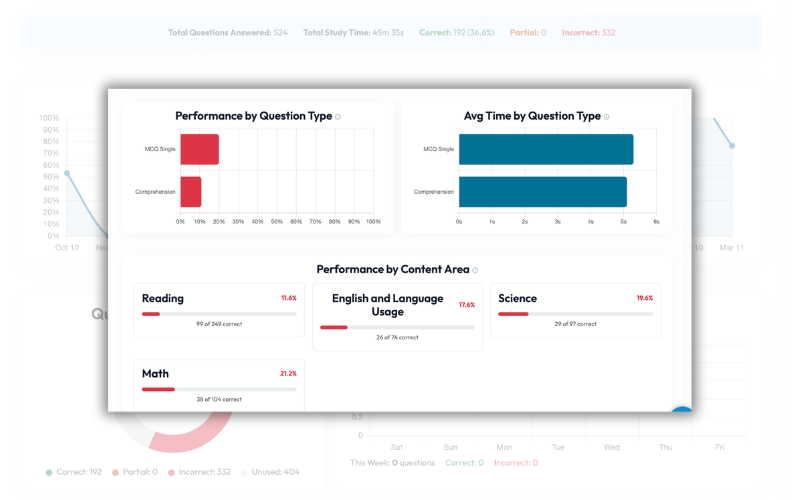
This is where the real insight lives. Every topic is sorted worst-first, showing question count, correct answers, and average percentage. This makes it effortless to identify and target your weak areas. Topics are also grouped into higher-level content areas for a broader view of your performance.
See how you perform across different question formats — MCQ, NGN, comprehension, ordering, and more. Each type shows your average score and average time per type, helping you identify which formats slow you down or trip you up.
Join thousands of nursing students who use Keslaly to study smarter and pass their exams.
Start Practicing Free